Monitor and Debug Workflows
Learn how to monitor workflow executions and debug issues from the Novu Activity Feed.
The Novu Activity Feed tracks the full execution lifecycle after a workflow is triggered. It provides real-time visibility into how workflows run, helping you understand what happened and why.
From the Activity Feed, you can inspect each workflow run and API request to see how each subscriber notification was processed.
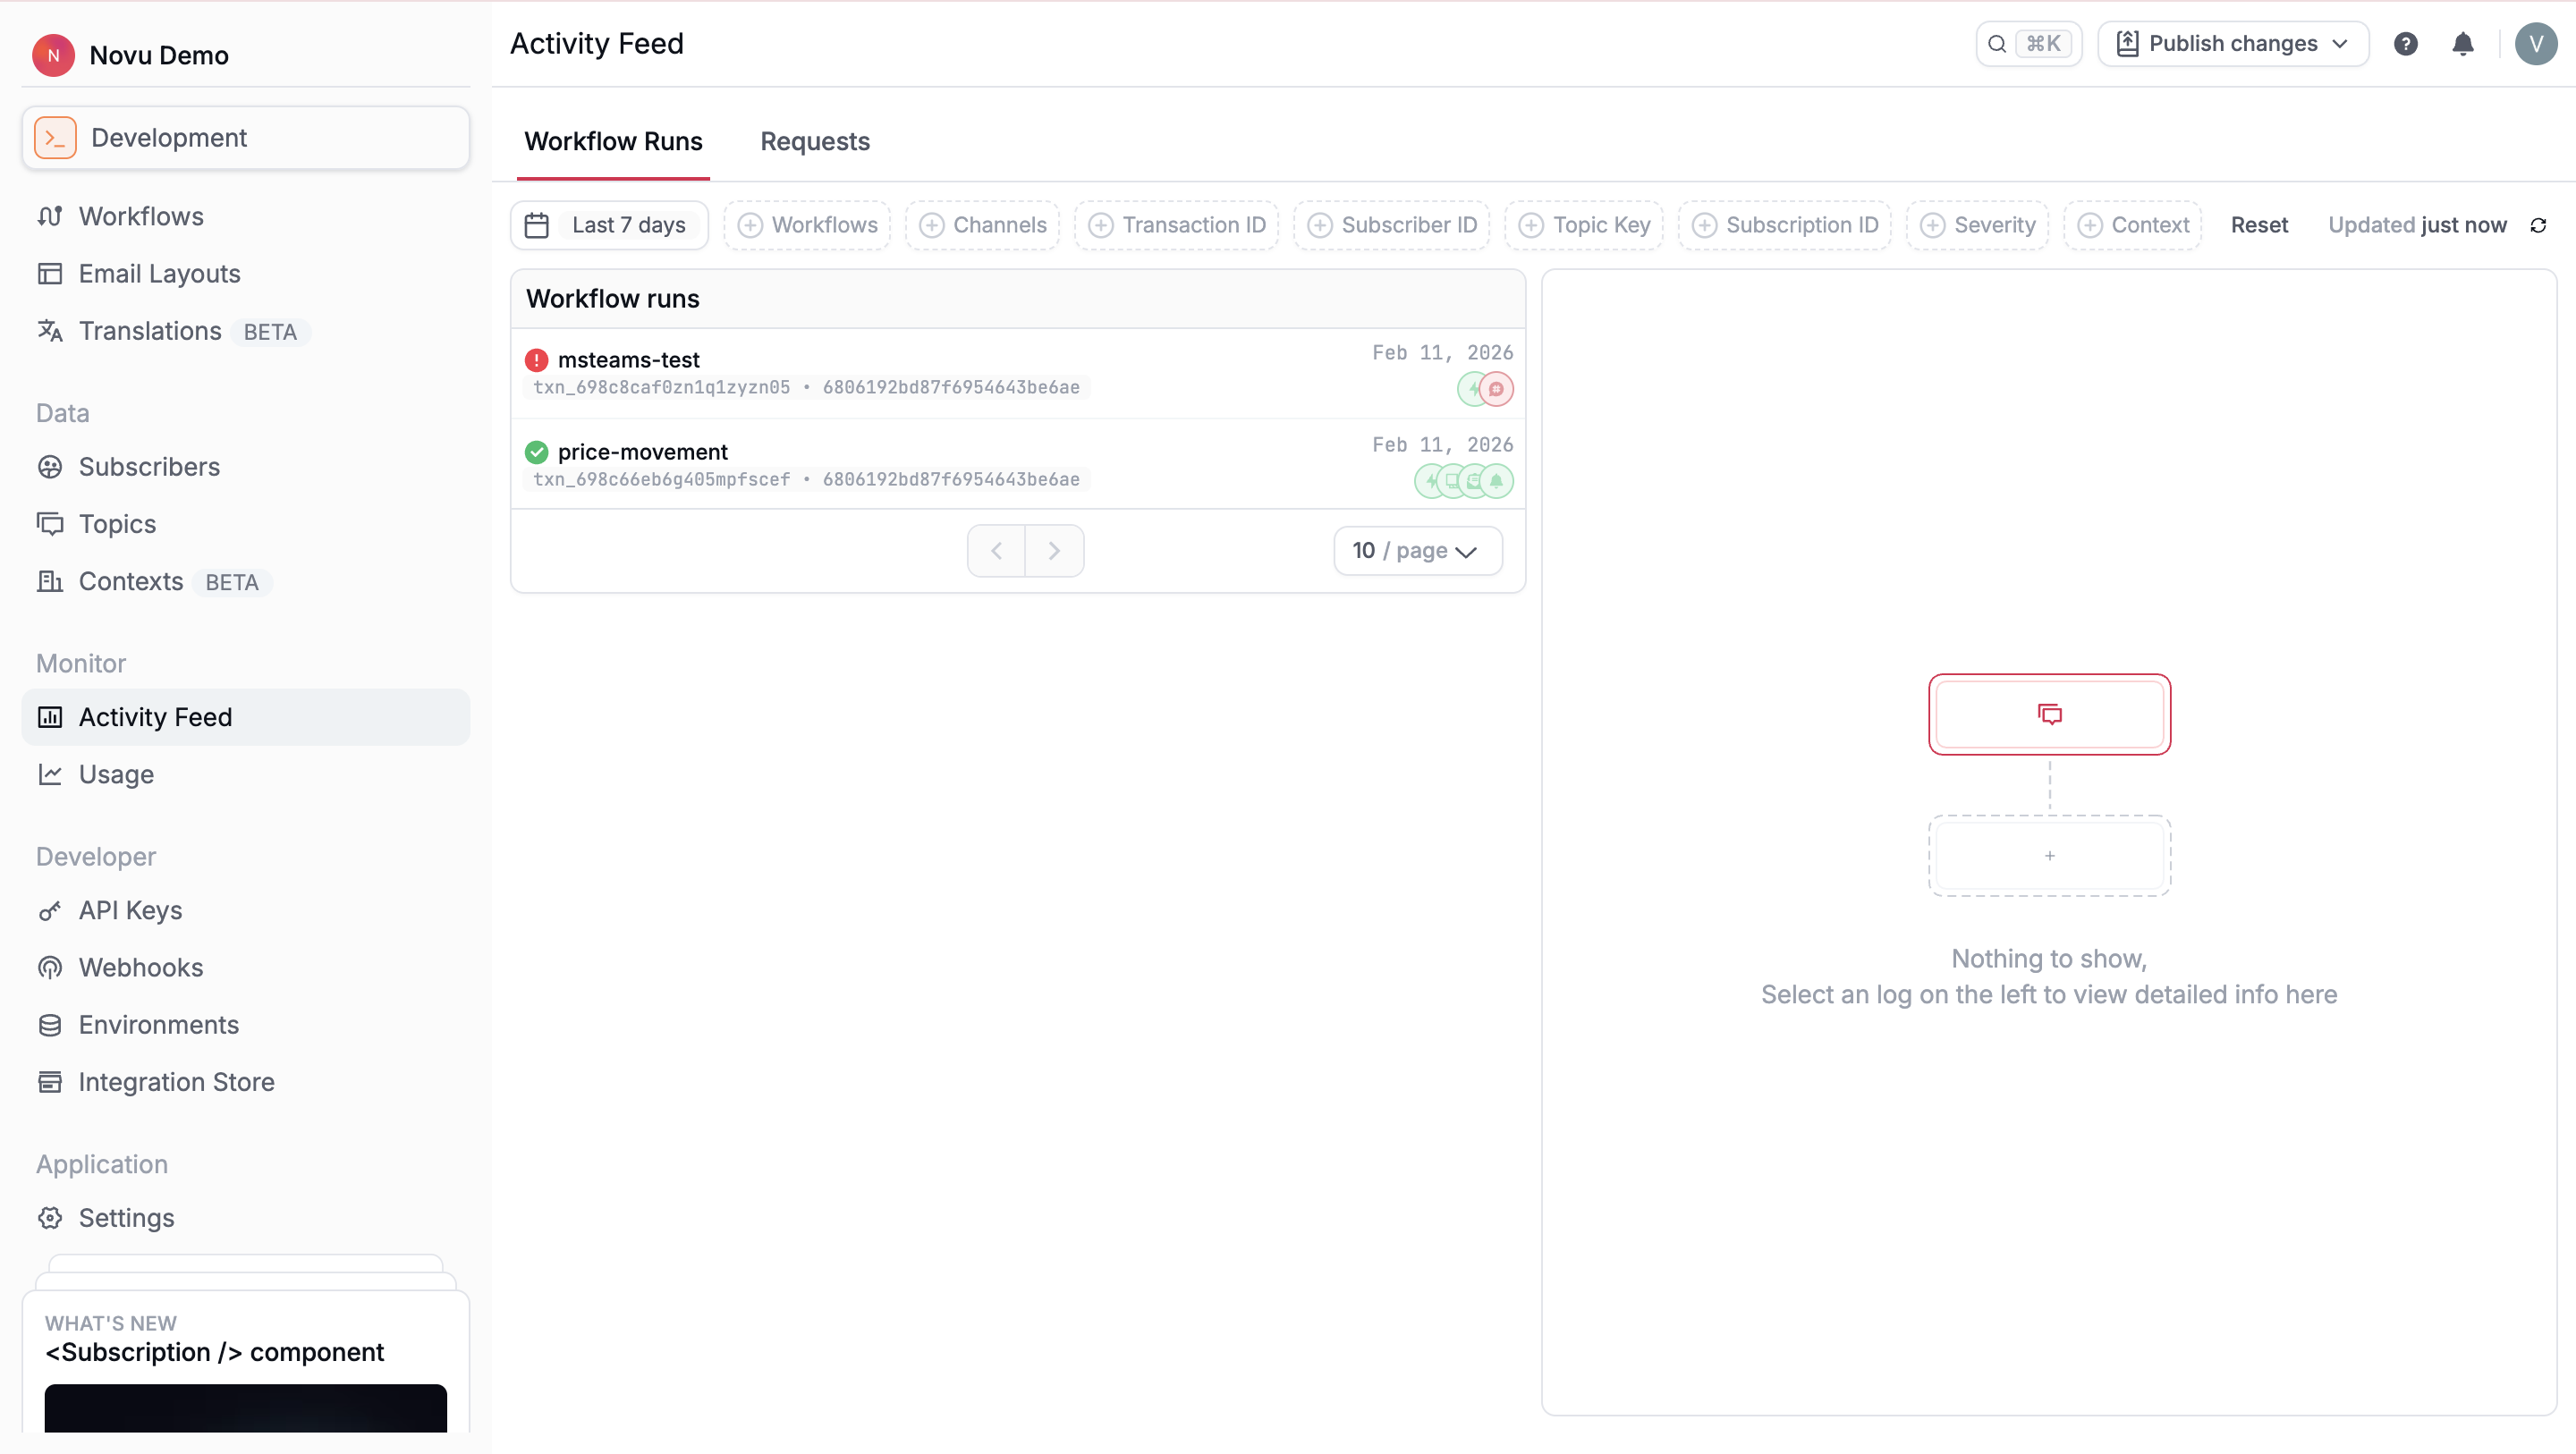
Inspect workflow runs
The Workflow Runs tab shows the details of every workflow triggered to each subscriber. Each run represents a single execution instance and reflects how the workflow behaved for that subscriber.
You can filter workflow runs using parameters such as time period, workflow identifier, and channel. Selecting a workflow run opens the run details view, which gives you access to execution outcomes of each step in the workflow and investigate delivery issues.
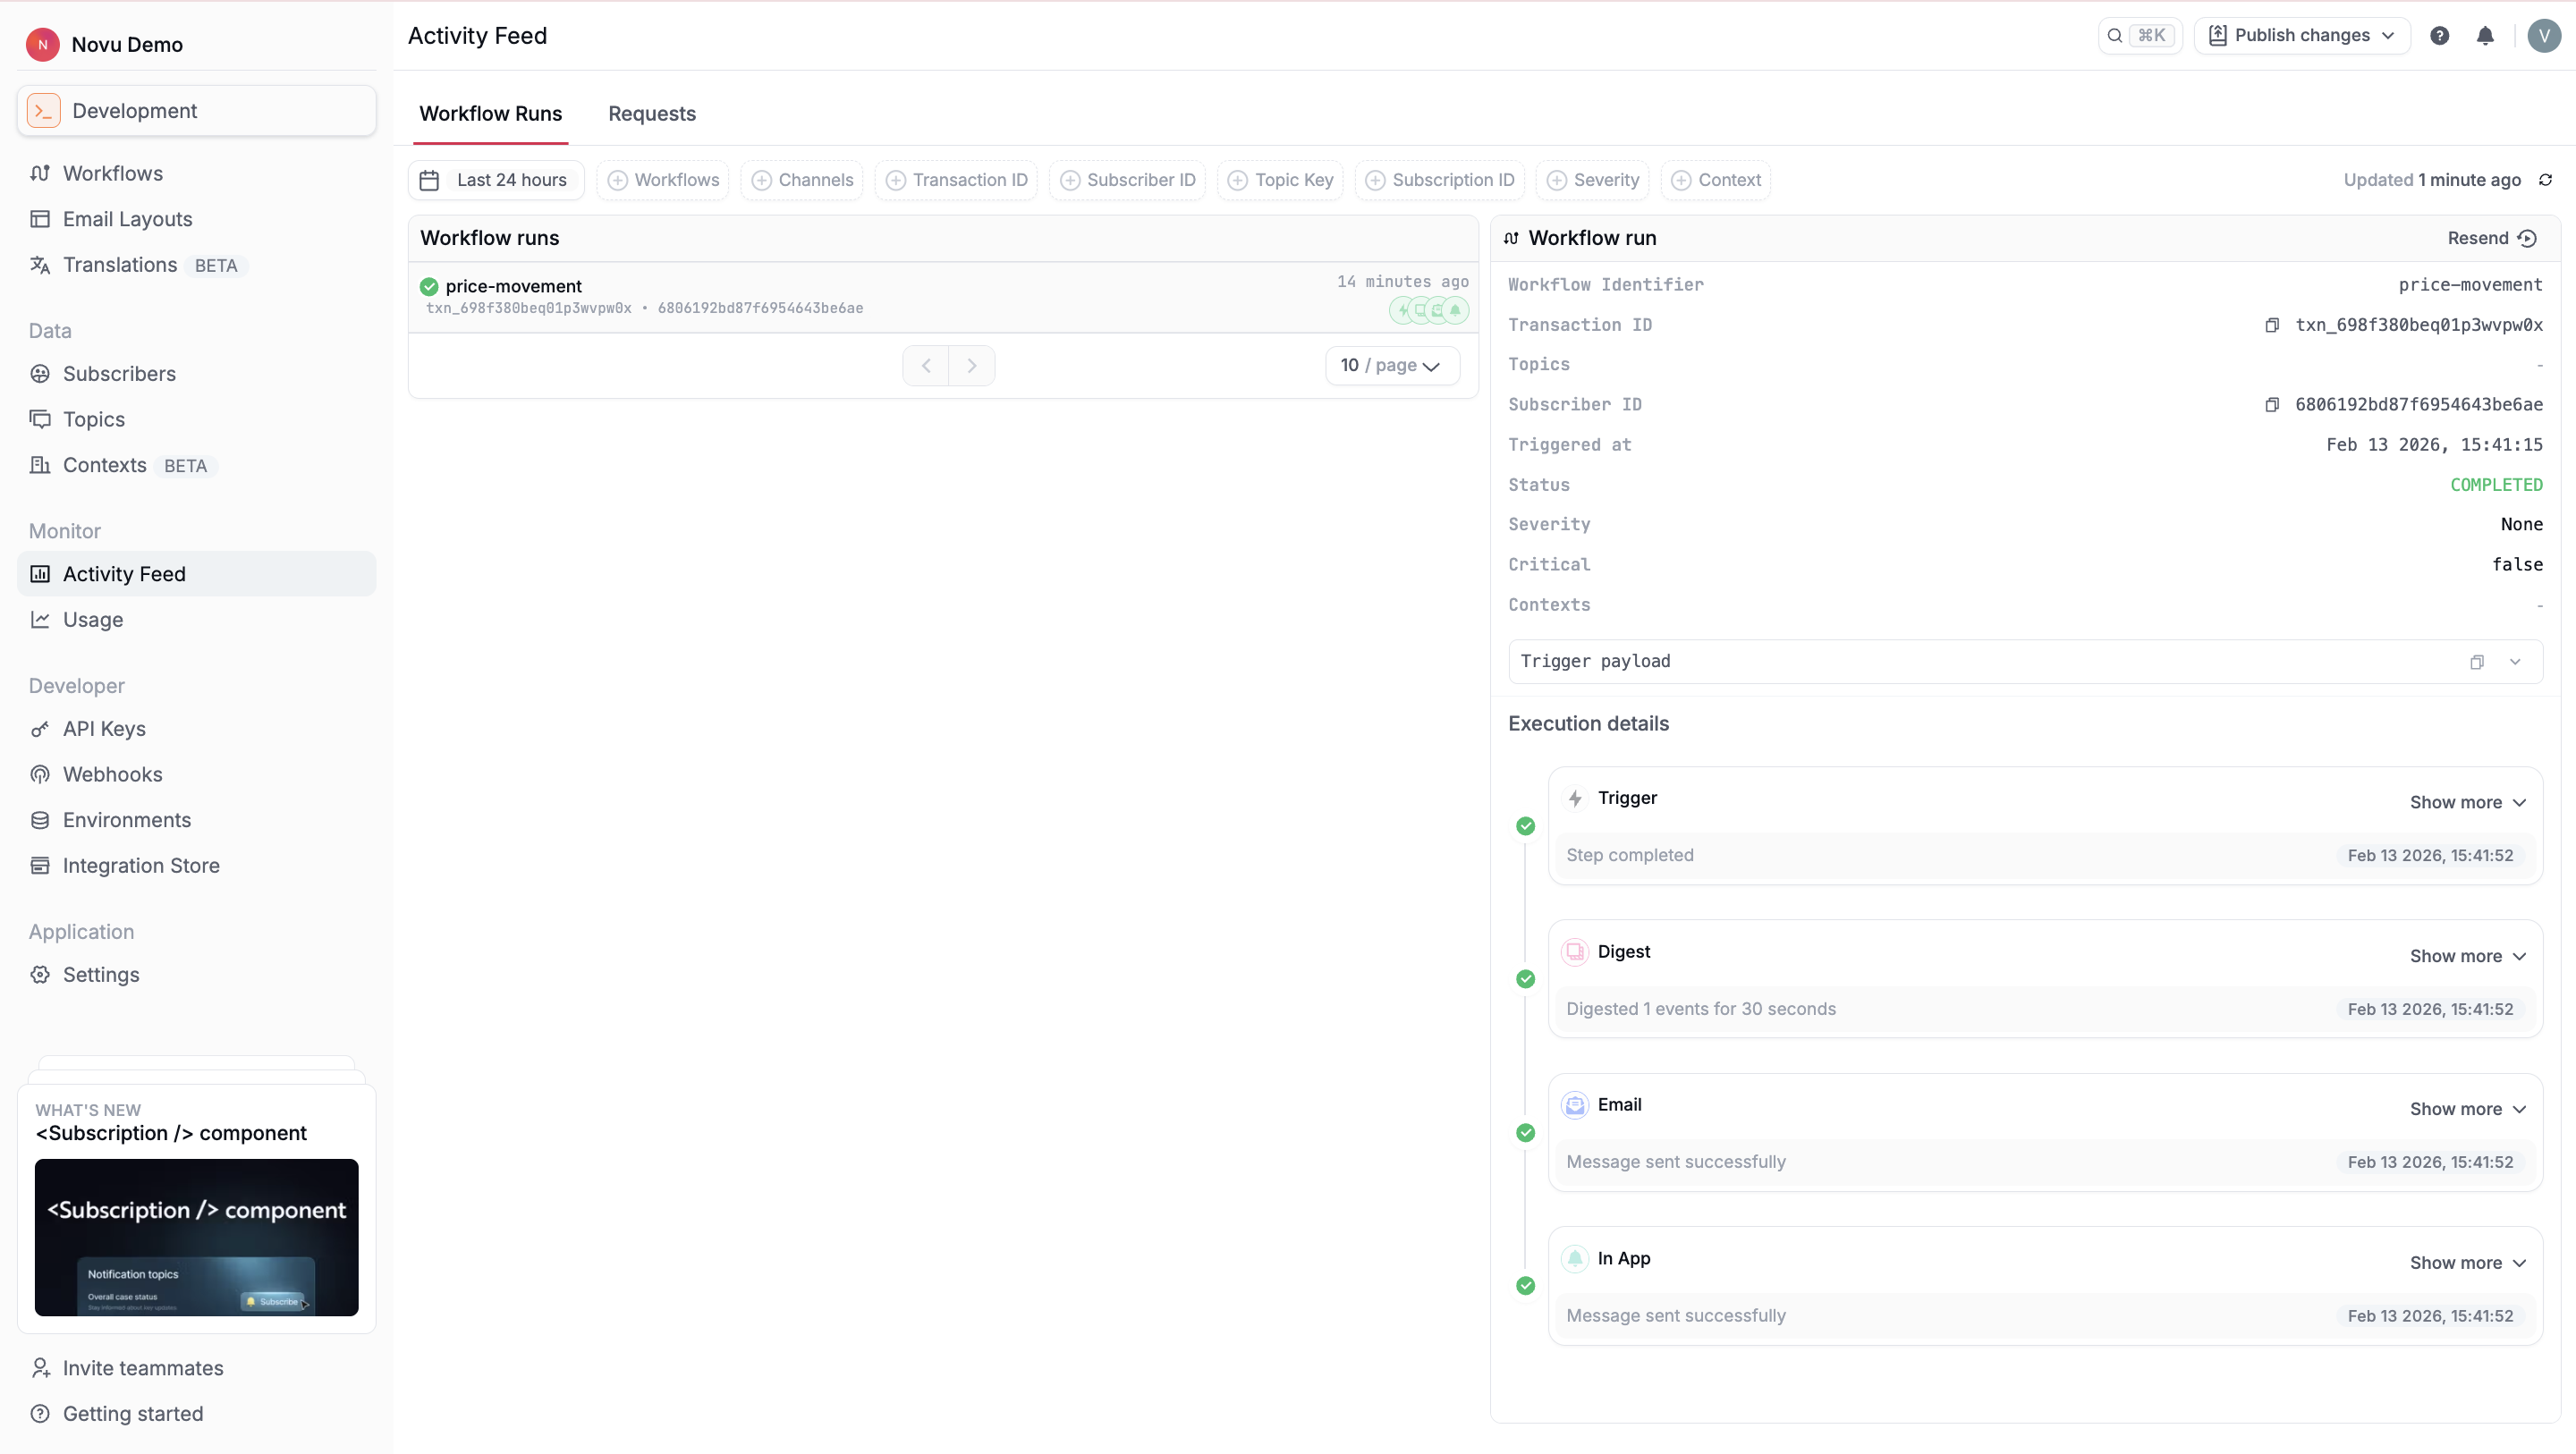
The workflow run details include:
| Field | Description |
|---|---|
| Workflow identifier | The unique identifier of the workflow that was executed. |
| Transaction ID | A unique ID associated with the trigger event. Use this to correlate workflow runs with trigger requests and logs. |
| Topic key | The topic key used to trigger the workflow, if the workflow was triggered to a topic. |
| Subscriber ID | The identifier of the subscriber for whom this workflow run was executed. |
| Triggered at | The timestamp indicating when the workflow execution started. |
| Status | The current state of the workflow run. Possible statuses include Completed, Pending, and Failed. |
| Severity | The severity level associated with the workflow execution, if defined. |
| Critical | Indicates whether the workflow was marked as critical. |
| Context data | Context values passed when triggering the workflow. |
| Trigger payload | The payload data sent with the trigger event and used to personalize notification content. |
Each workflow run also includes execution details that show how Novu processed each step for a single subscriber. The timeline is ordered chronologically and reflects the internal state transitions of each step as the workflow runs.
Execution details are step-specific and vary depending on:
- The type of step
- Whether the step succeeded, was skipped, or failed
- Provider behavior and delivery outcomes
Inspect trigger requests
The Requests tab in the Activity Feed shows detailed information about every request made to the Event API. Selecting a request opens a detailed view of how Novu processed it, the API response, and execution traces.
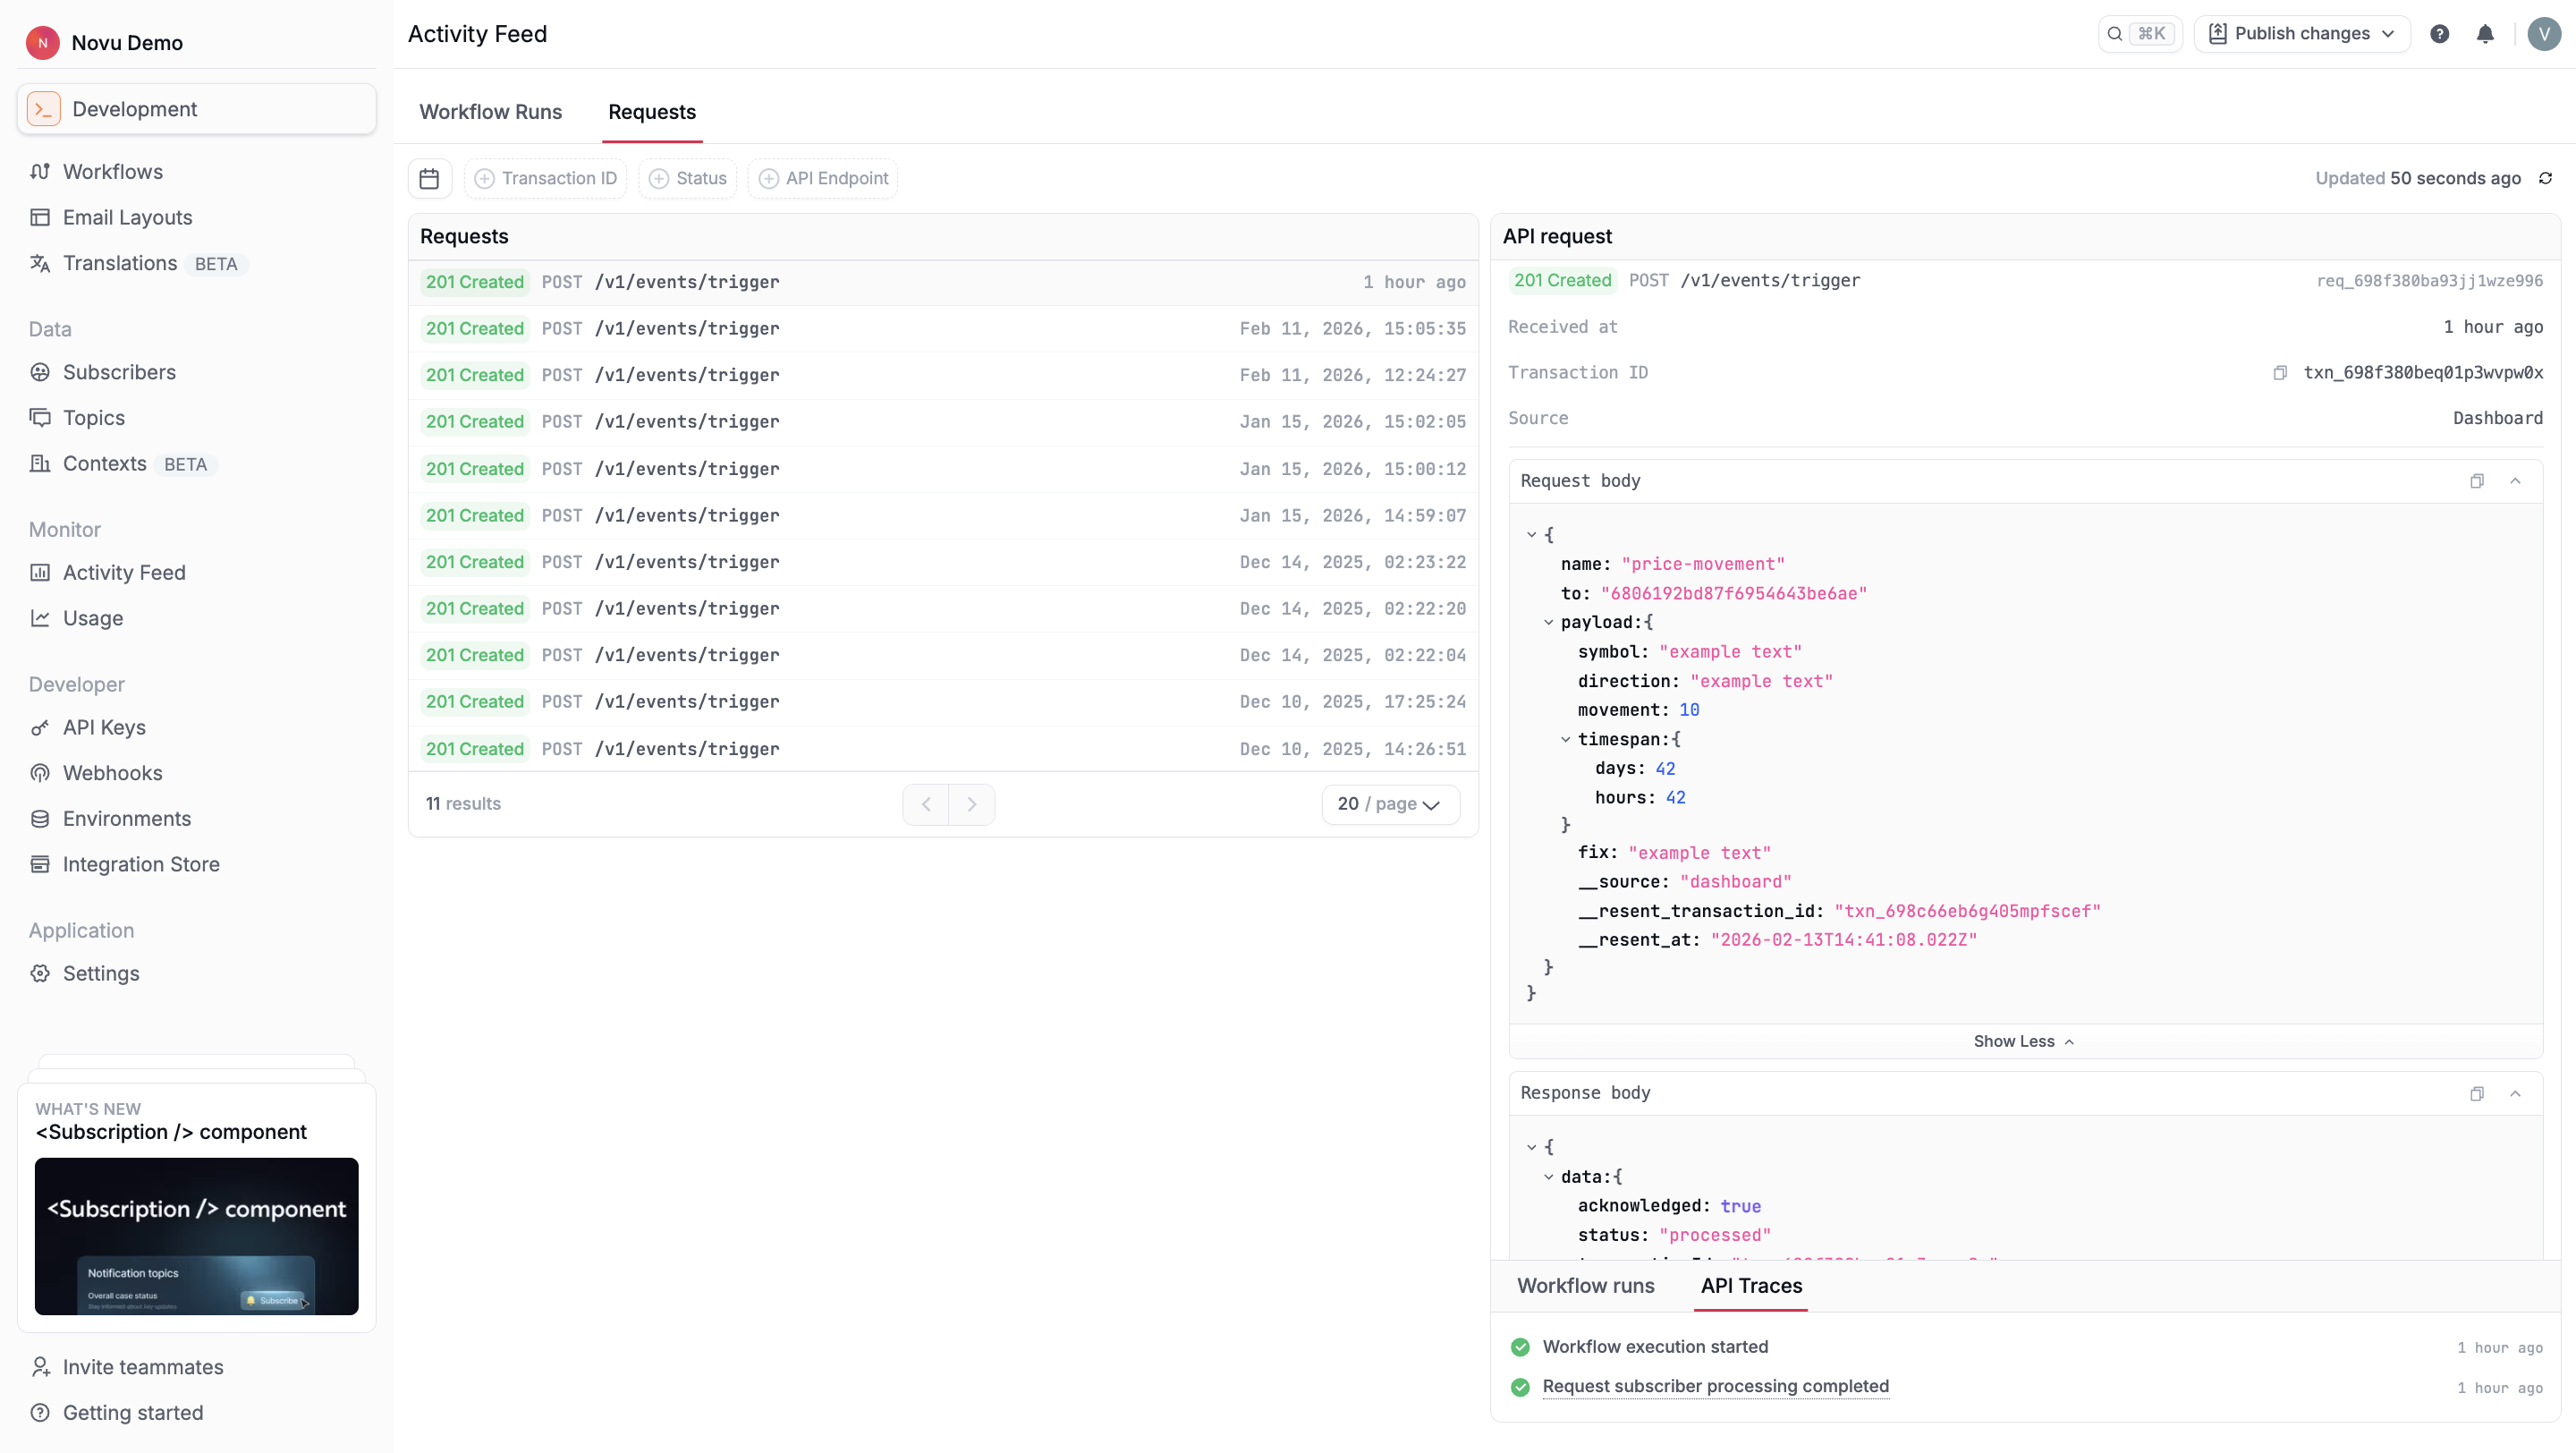
You can filter requests using parameters such as time period, transaction ID, statuses or API endpoint. When you open a request, Novu displays details about the API call:
| Field | Description |
|---|---|
| Endpoint | The API endpoint that received the request, for example, POST /v1/events/trigger and a unique identifier for the API request. |
| Received at | Timestamp indicating when Novu received the request. |
| Transaction ID | The transaction associated with the trigger. Use this to correlate the request with workflow runs. |
| Source | Indicates where the request originated, either the Dashboard or the API. |
| Request body | The payload sent in the API call, including the workflow identifier, subscriber or topic targeting, and any additional data. |
| Response body | Novu’s response to the request, confirming whether it was acknowledged and processed successfully. |
Each request also includes API trace events that show how Novu handled the trigger internally.
Common trace entries include:
- Workflow execution started
- Request subscriber processing completed